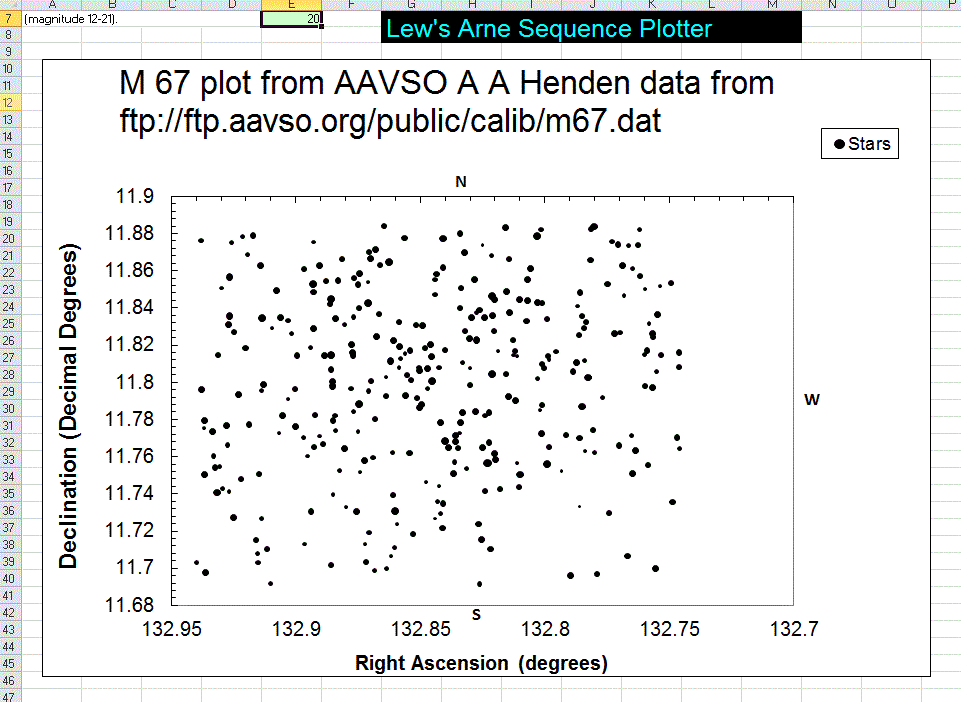
This Excel workbook uses AAVSO's sequence data, takes it and converts the decimal degree Right Ascension values to hours, minutes, and seconds, and the decimal degrees to degrees, arc minutes and arc seconds. The data is then plotted as a star chart (using the North UP convention).
How to use: Download this spreadsheet and save it as Henden.xls.
Use this software at your own risk.
This spreadsheet was first issued on Feb. 7, 2002 and slightly revised in April 2014, and Lew wants any feedback - especially bug reports. E-mail Lew at Lew(at)lewcook.com. Use the circled @ instead of the (at), of course.. You wouldn't believe the tasteless junk e-mail you get if you put your e-mail address on a web page! Or maybe you would ...
2. In Excel, Open AAHPlot.xls then open the sequence file as an Excel spreadsheet also.
3. Select (highlight) all the data in that file, click Edit, Copy. Include the header line. But DON'T include blank lines!!
4. Click Window, Click AAHplot.xls, Click cell A1 in the raw data sheet. Click Edit, Paste
5. Look at the data. Note that the last row is repeated - perhaps as many as 498 times
if you have only one star. I wanted to allow you to be able to plot up to 500 stars yet not have to
fiddle with the data.
6. The RA and Dec values in hh mm ss and dd mm ss form show up on the Prepared Data sheet
7. Click on the Plot tab and look at the plot. The stars are sized, and you may enter a magnitude
cutoff if you just want stars brighter than some magnitude (say 19)
8. IMPORTANT: Save the spreadsheet as Subject.xls where Subject is the name of the field.
Use your master copy of AAHplot.xls to make more charts. Do not merely paste over an already used sheet. It is necessary to copy the last line of data numerous times to fill the data block to line 500. Of course, if you have more than 499 stars, you will need to choose which 499 you wish to plot by editing the .dat file. All 499 stars are plotted but if you have only 200 stars, number 200 is going to be plotted 299 times (but you can't tell it by looking at the plot). To identify the stars, position the cursor over the star of interest and find that entry in the Prepared Data sheet.
If you want to see how the M67 field looks plotted, its above.
AAHplot.xls is a star chart plotting spreadsheet.
Thanks to the hard work by Arne Henden of the US Naval Observatory and AAVSO, there are numerous photometric sequences available for interesting stars. These are located on the AAVSO ftp server at
ftp://ftp.aavso.org/public/calib/
Then: Save this spreadsheet as AAHplot.xls. This preserves the master copy as Henden.xls.
You will never use it except to make a replacement copy of AAHplot.xls. Otherwise you've got to download it again. That is at DOWNLOAD AAHplot.xls
Disclaimer and Caution
Although the files available for download were produced free of and checked for viruses, always check any file downloaded from the www for viruses or harmful code. The software available here, while believed correct and free of defects, is offered without any guarantee of accuracy or freedom from error. Use this software at your own risk. Although the spreadsheet believed to be accurate and no claim of accuracy or precision is made. Here's what the plot looks like:

Instructions
1. Copy the sequence file to your hard drive.
If any of the first 500 lines are blank, the plotting software interprets this as a zero and you will get your stars plotted but a bright star at the Vernal Equinox will be plotted on the same chart so you may not like the scale.
Copyright and Use Permission
This software is made available for the general public good, however it may not be sold or
included in any other publication or software without the author's permission. You may distribute it freely for non commercial purposes with credit to the author.
Copyright (C) 2002, 2014 by Lewis M. Cook

CBA Home Page